We recently posted an article on our sister site, Bold City Design about an upcoming Google ‘Speed Update’ For Mobile that will be taking Place in July of 2018. Following that article being published, we had an existing client come to us expressing concerns about their page load times. Although all reports that the client was conducting on popular tools like Pingdom Speed Test as well as Google Page Speed Insights Test we’re coming back very positive (under 3 second load times across the entire site), their Google Analytics was reporting 8-9 second load times.
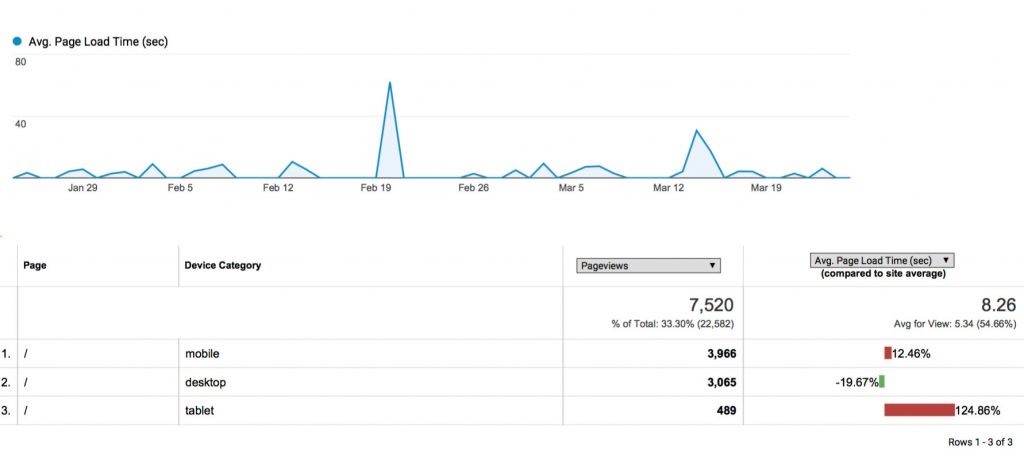
Below is a screenshot of their analytics report from the last 30 days:
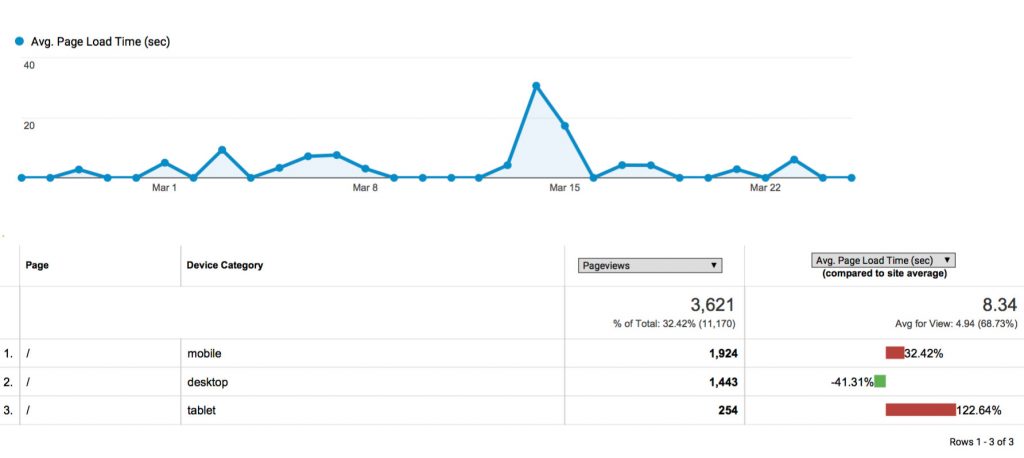
After performing a thorough analysis of the site, it was quite evident that the 8.34 second load time being reported in analytics was invalid. The data in analytics was saying some days the average load time was under 2 seconds with random spikes up to 30+ and even 60+ seconds. What was this data that was throwing off the overall average? Obviously, the client wanted answers and we wanted to reassure them that their website was in good shape so we took a deeper dive into the data.
The Results
The results we found can be categorized into two categories:
- Invalid Traffic
- Small Subset of Overall Data
1. The first big issue we found with the data was random spikes that would cause the overall average to skyrocket. Per the screenshot above, it is evident that traffic was consistent at 2-4 seconds average load time for the majority of the month only to skyrocket to 35 seconds on March 13th. The reasoning behind this was invalid traffic. When you dive into the subset data of the traffic from March 13th, we found that there was a surge of visitors coming from India or from invalid IP addresses that were either spam traffic or some kind of brute force attack on the website. This traffic, likely in an attempt to ‘hack’ the website was negatively affecting our client’s average load times.
2. The second issue with Google Analytics speed tracking is it only tracks 1% of the total traffic that comes to your site. As an example, say this website on average received 100 visitors per day. On March 13th, that same website received 1000 visits, 900 of which came from invalid, spam traffic. Google Analytics would likely only track 1 visit of the ‘real’ visitors and 9 of the invalid visitors based on the 1% rule. If the real visitors had a load time of 2 seconds but the invalid visitors had a load time of 50 seconds, this would average out to a load time of 45.2 seconds. Obviously extremely skewed from the only real visitor that Google Analytics tracked.
What This Means For You
When looking over your Google Analytics, make sure you look at small subsets of data. If you notice a particular day where the data seems vastly different from the rest of the month, look deeper into the specific traffic from that day. In many cases, you may need to consider excluding the traffic from that day in order to get a more accurate report for your website. Ensure you do not jump to conclusions before performing a thorough investigation.
Need More Help?
Get in contact with us at Bold City Agency. We would be happy to go through your Google Analytics data and touch on ways we could improve your website speed & content for better search engine optimization and a better user experience.
Who Are We?
Bold City Agency is a full-service website design, development, and marketing company based in Jacksonville, Florida. We service clients both locally and throughout the nation. We have the technical background to service clients on WordPress, WooCommerce, Magento, Drupal, Shopify and other popular platforms. We also offer Jacksonville search engine optimization services with plans starting as low as $100 per month.